For Educators
Resources and lessons to help teach about floats and explore float data
What is a Float?
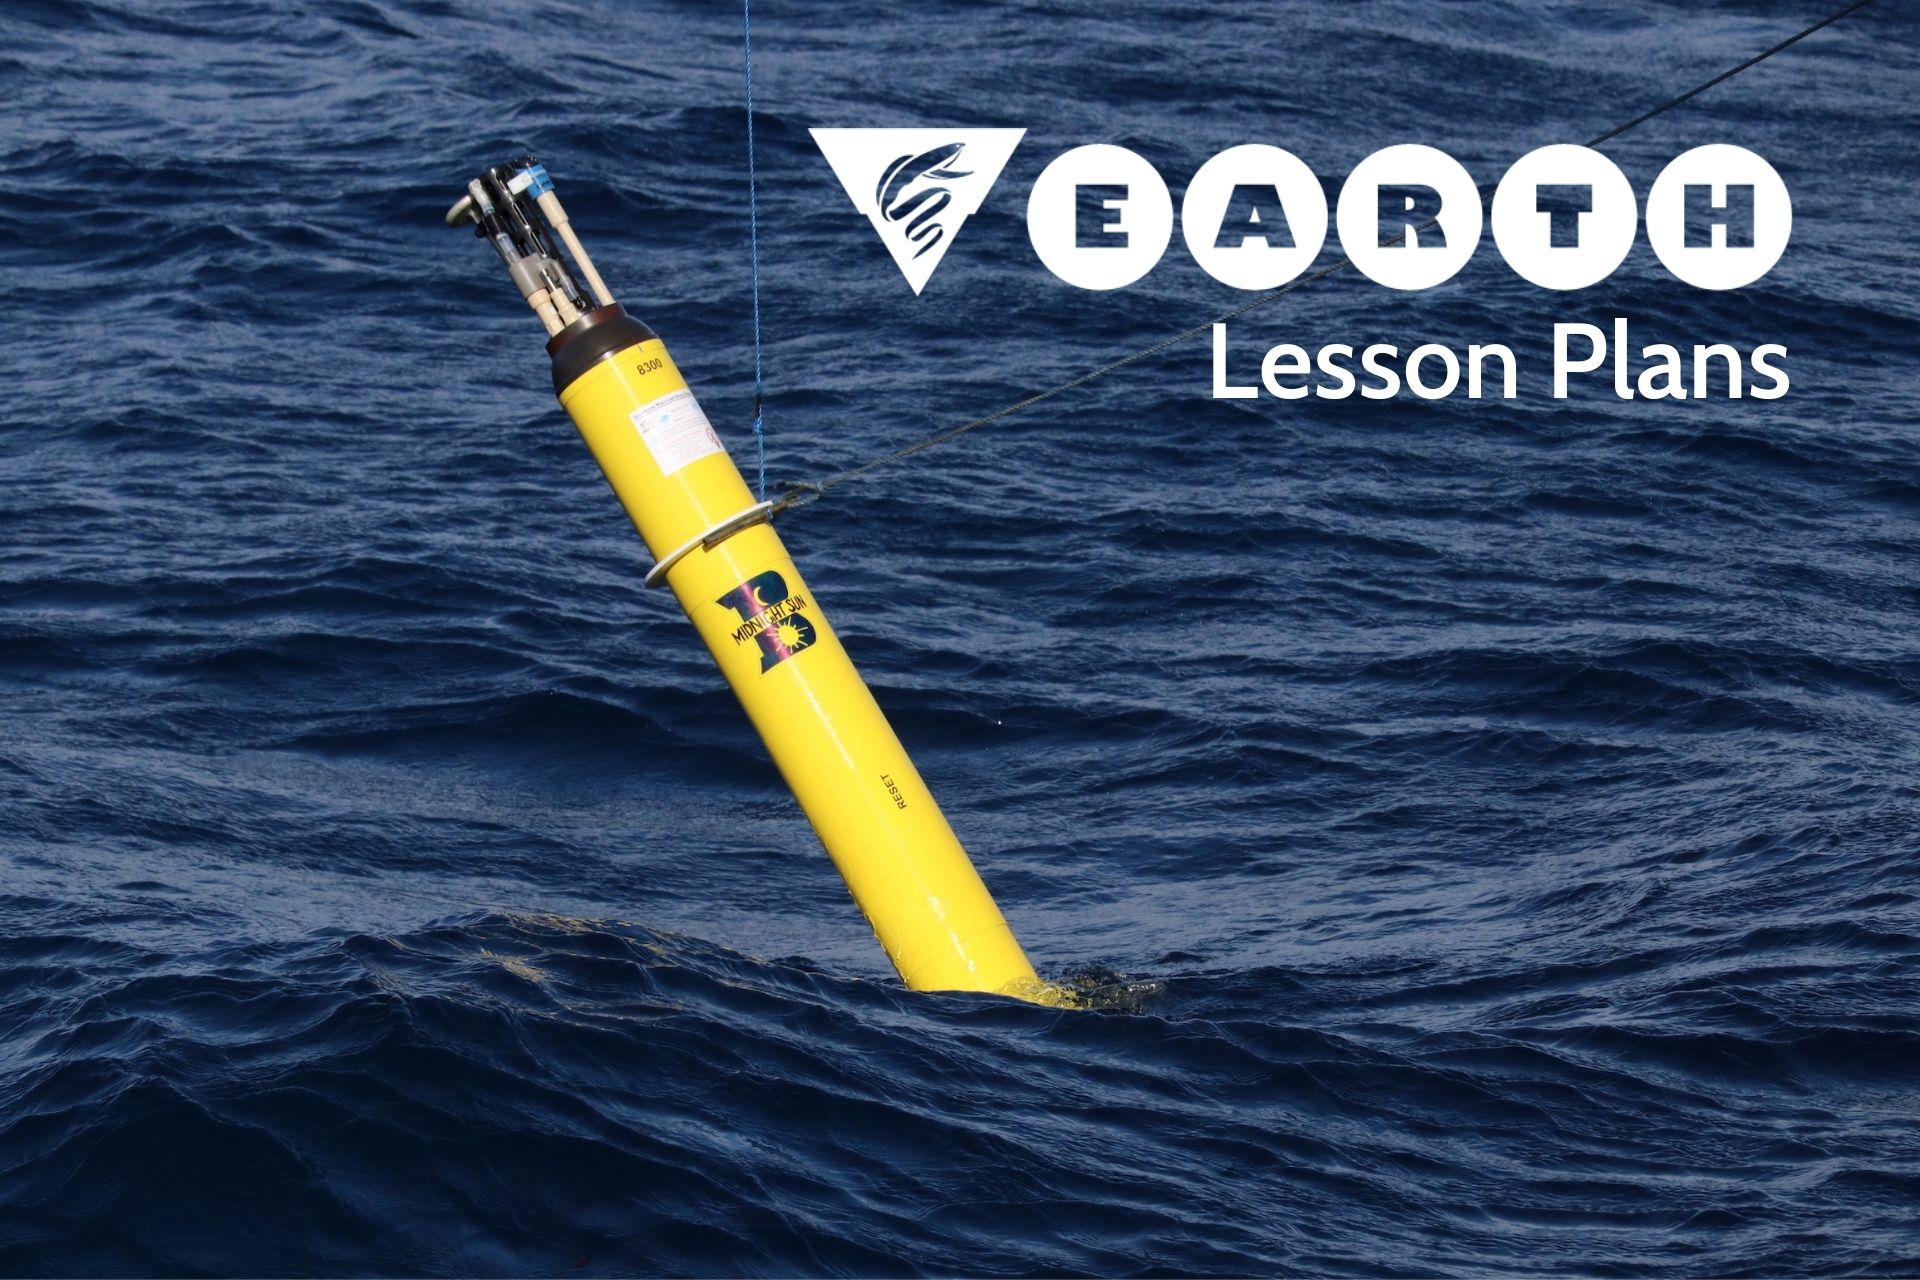
A biogeochemical float spends its life drifting through the ocean, changing depth and collecting data at programmed intervals. It is battery-powered and hosts a suite of chemical and optical sensors.
Videos and Animations
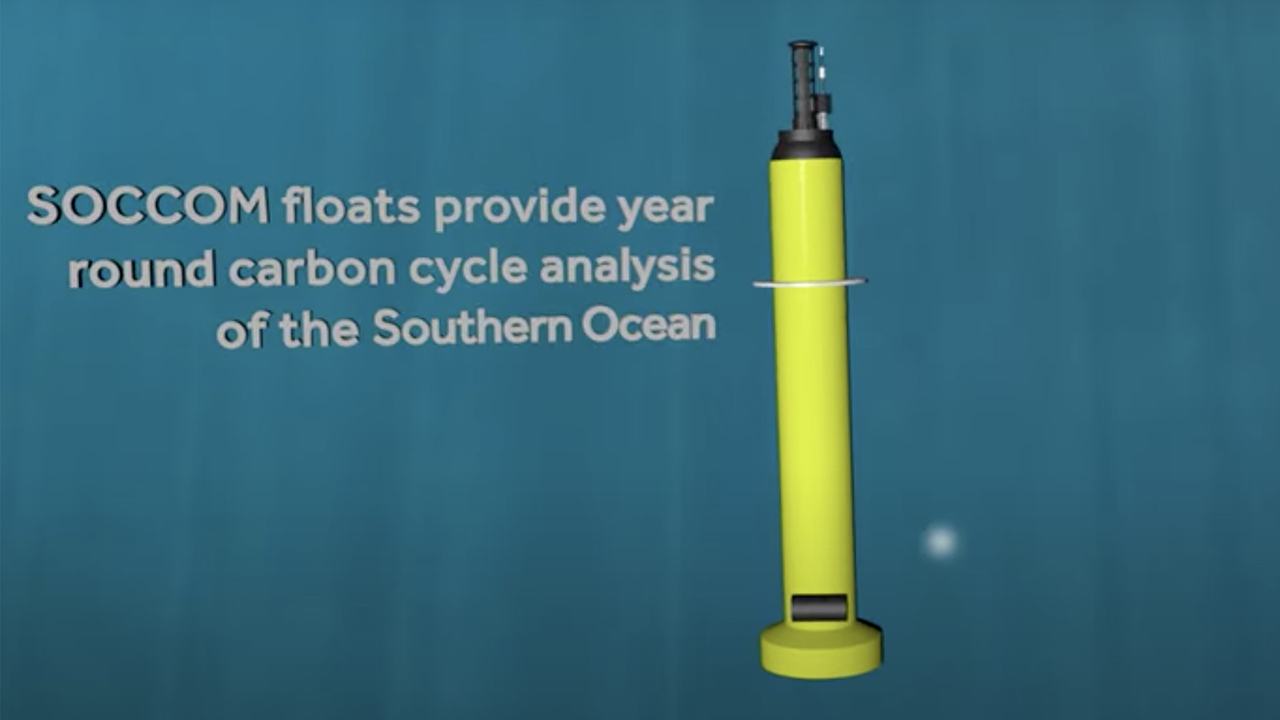
Day in the Life of a SOCCOM Float
Animation by Ted Blanco (Climate Central)
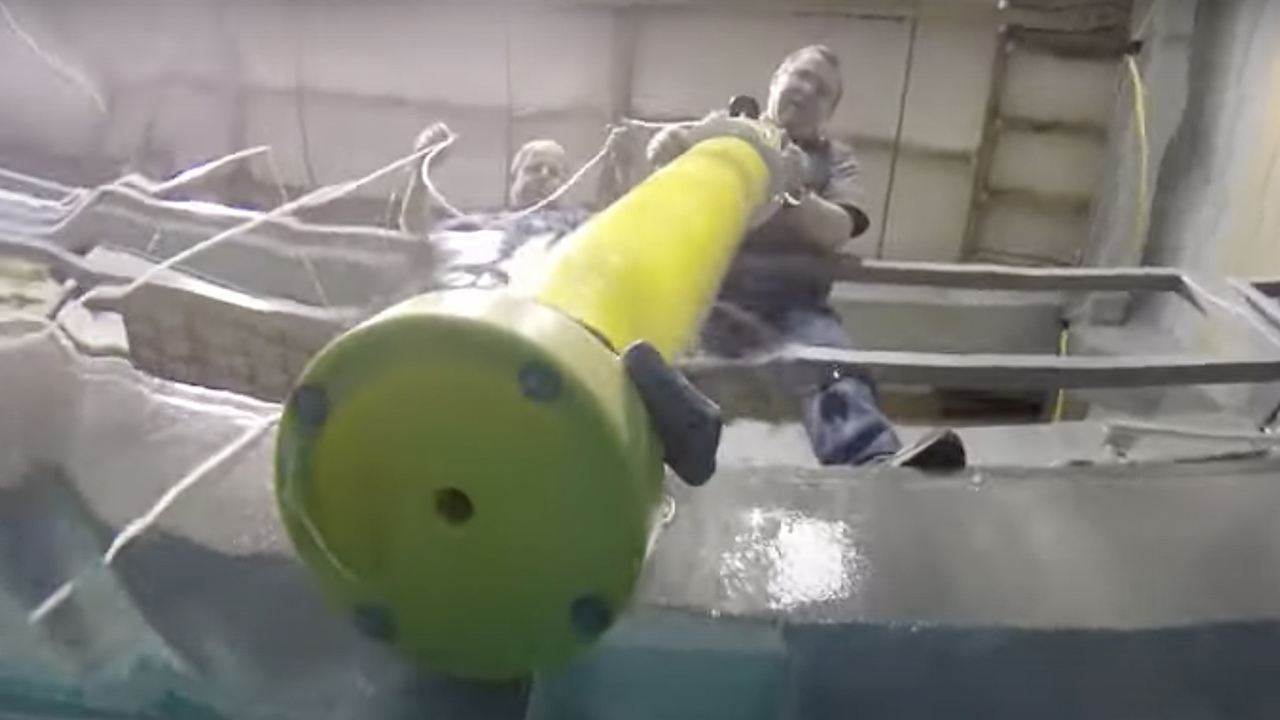
SOCCOM in the Tank: Testing the Floats
Follow scientists as they test new technology in SOCCOM floats.
Information Pages
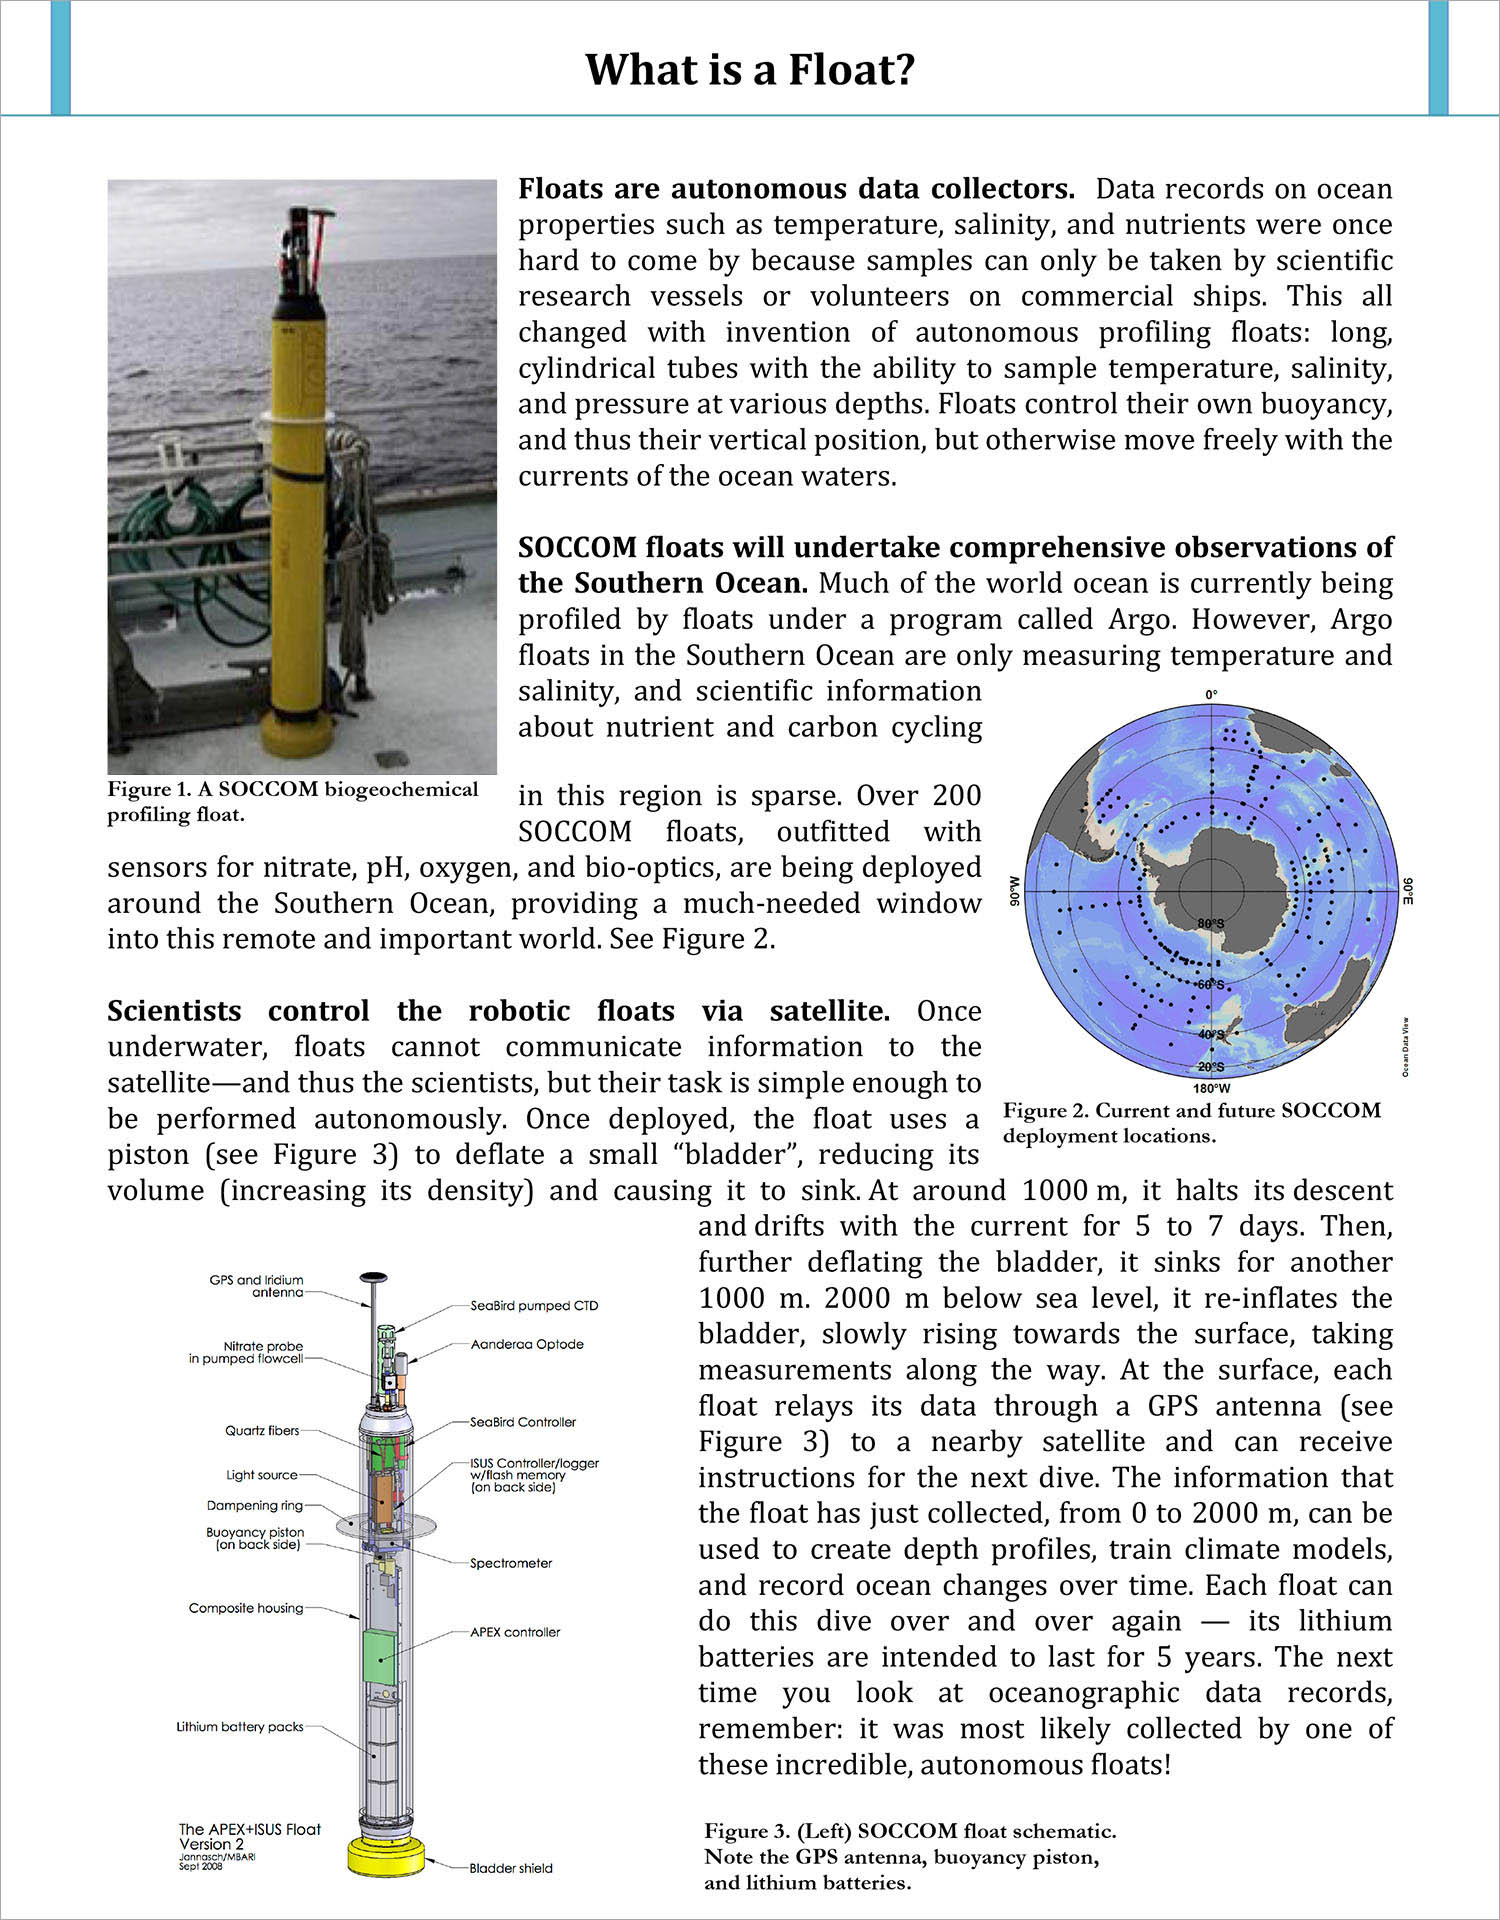
What is a Float?
One page intro to biogeochemical (BGC) floats.
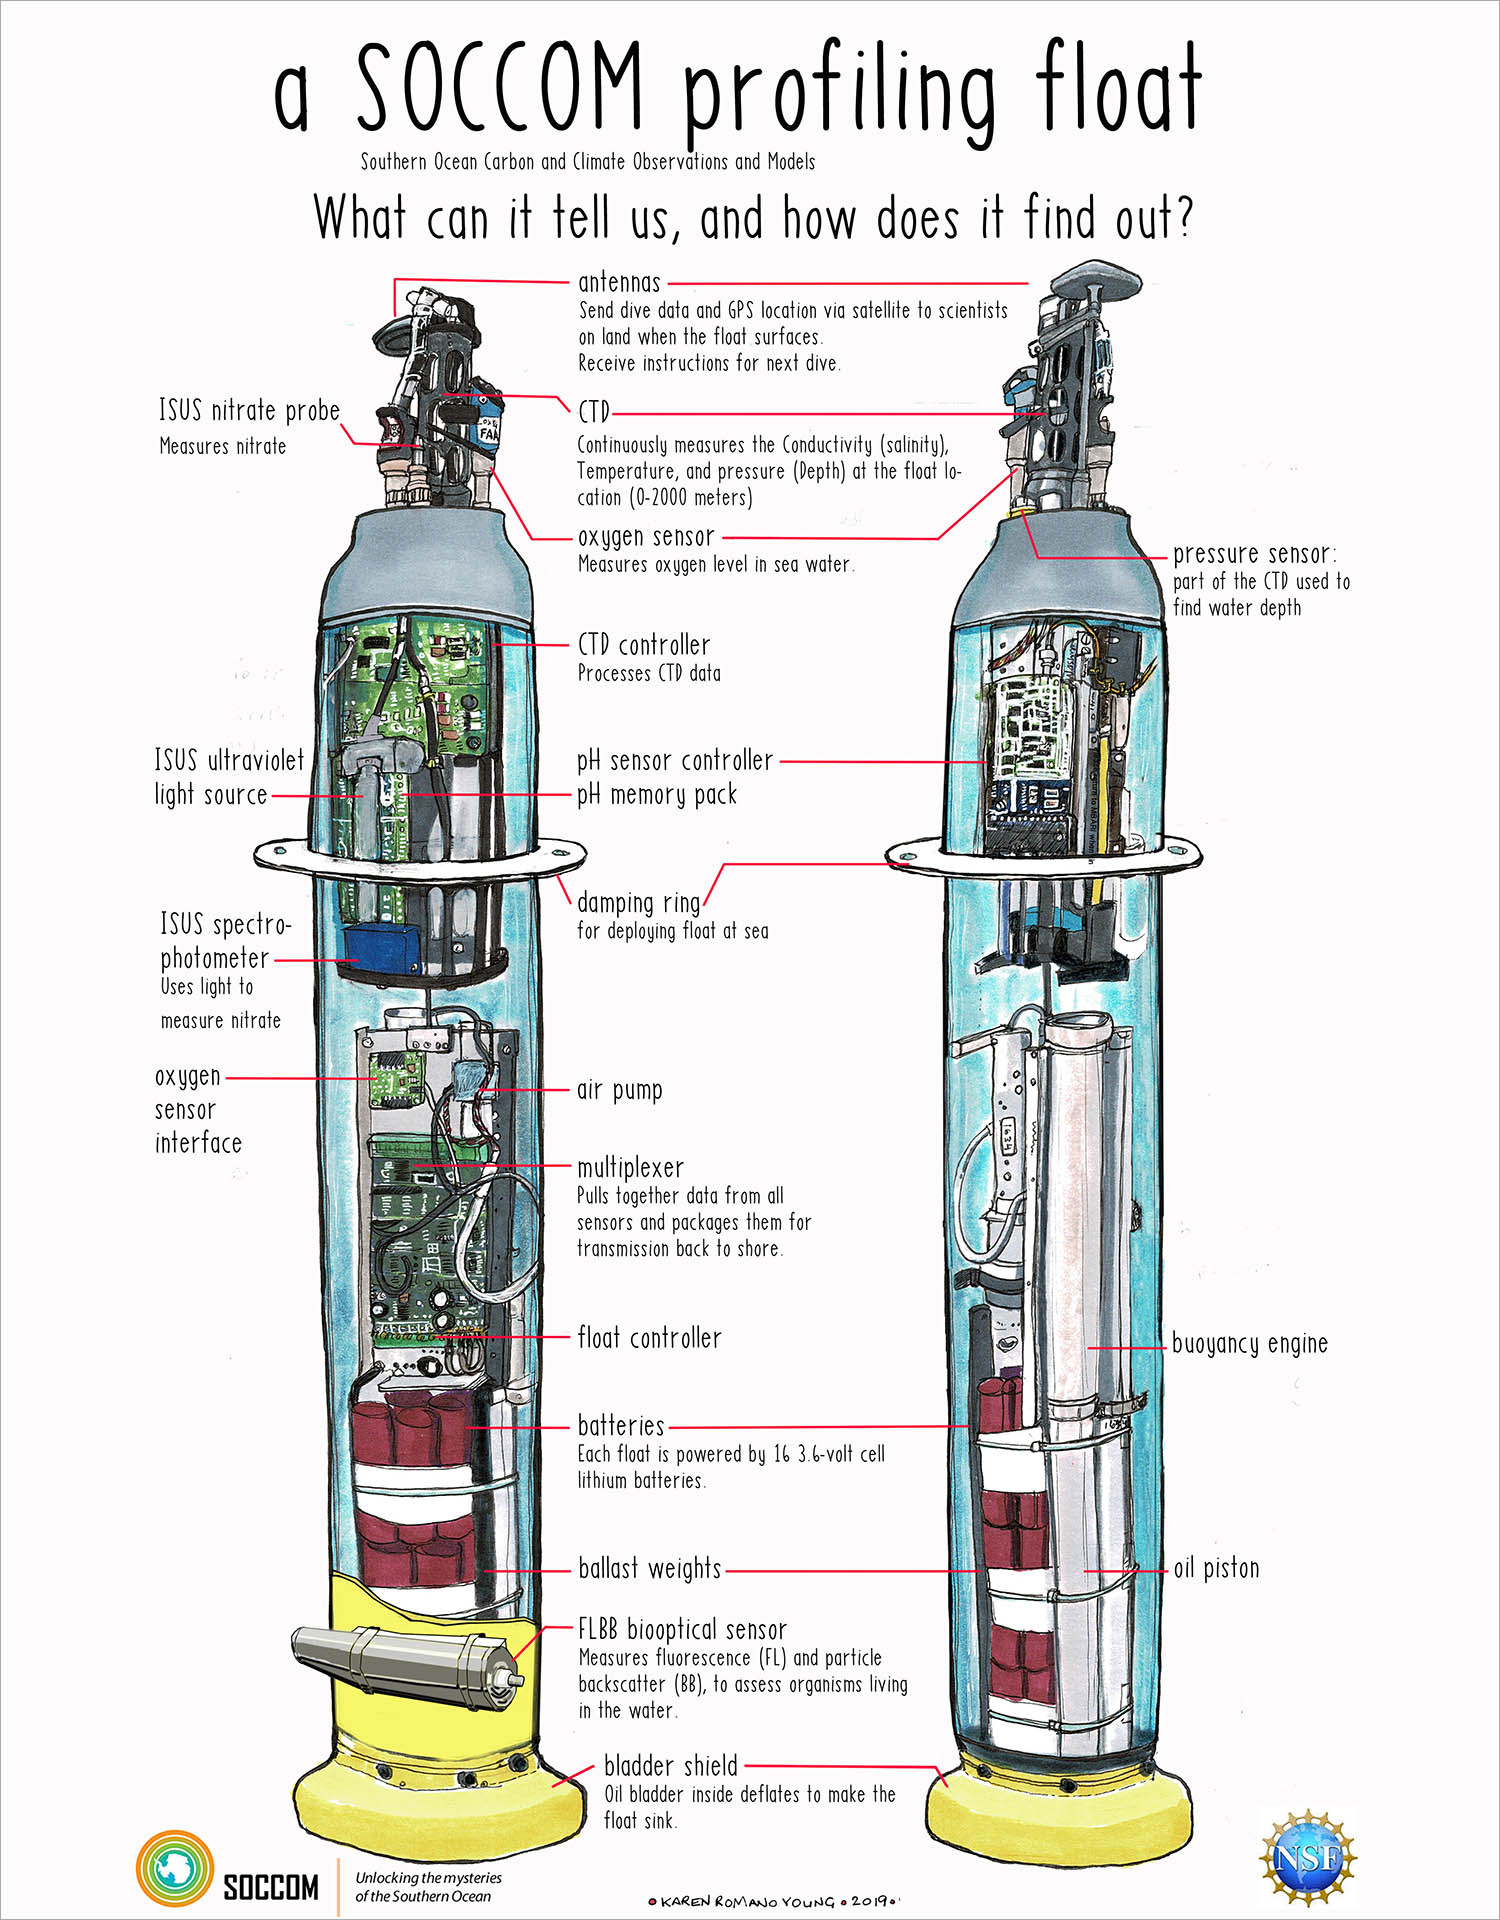
Float Diagram
Original artwork by Karen Romano Young, designed to be printed out on tabloid size paper 11×17.
How to Access Data
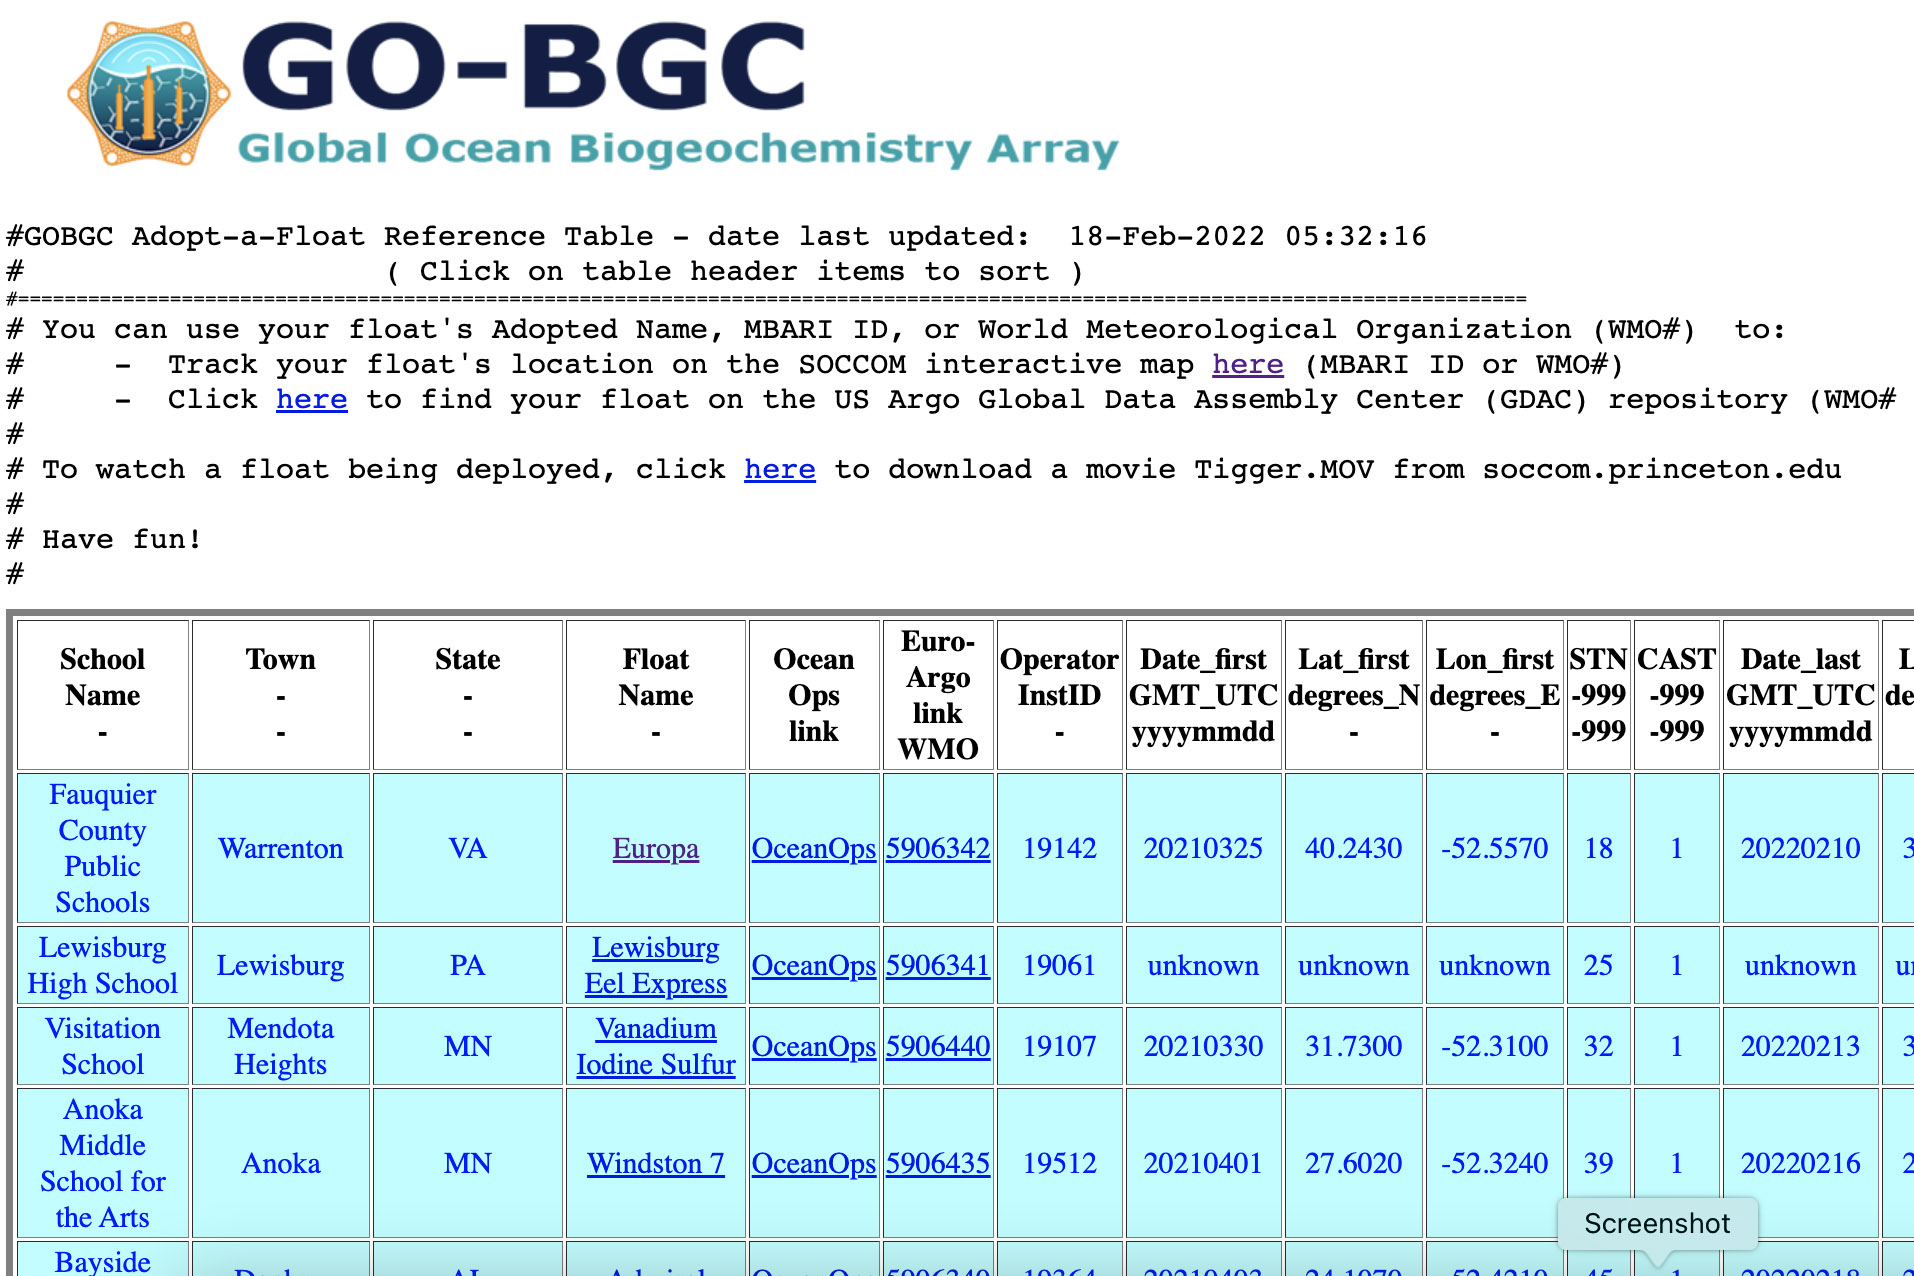
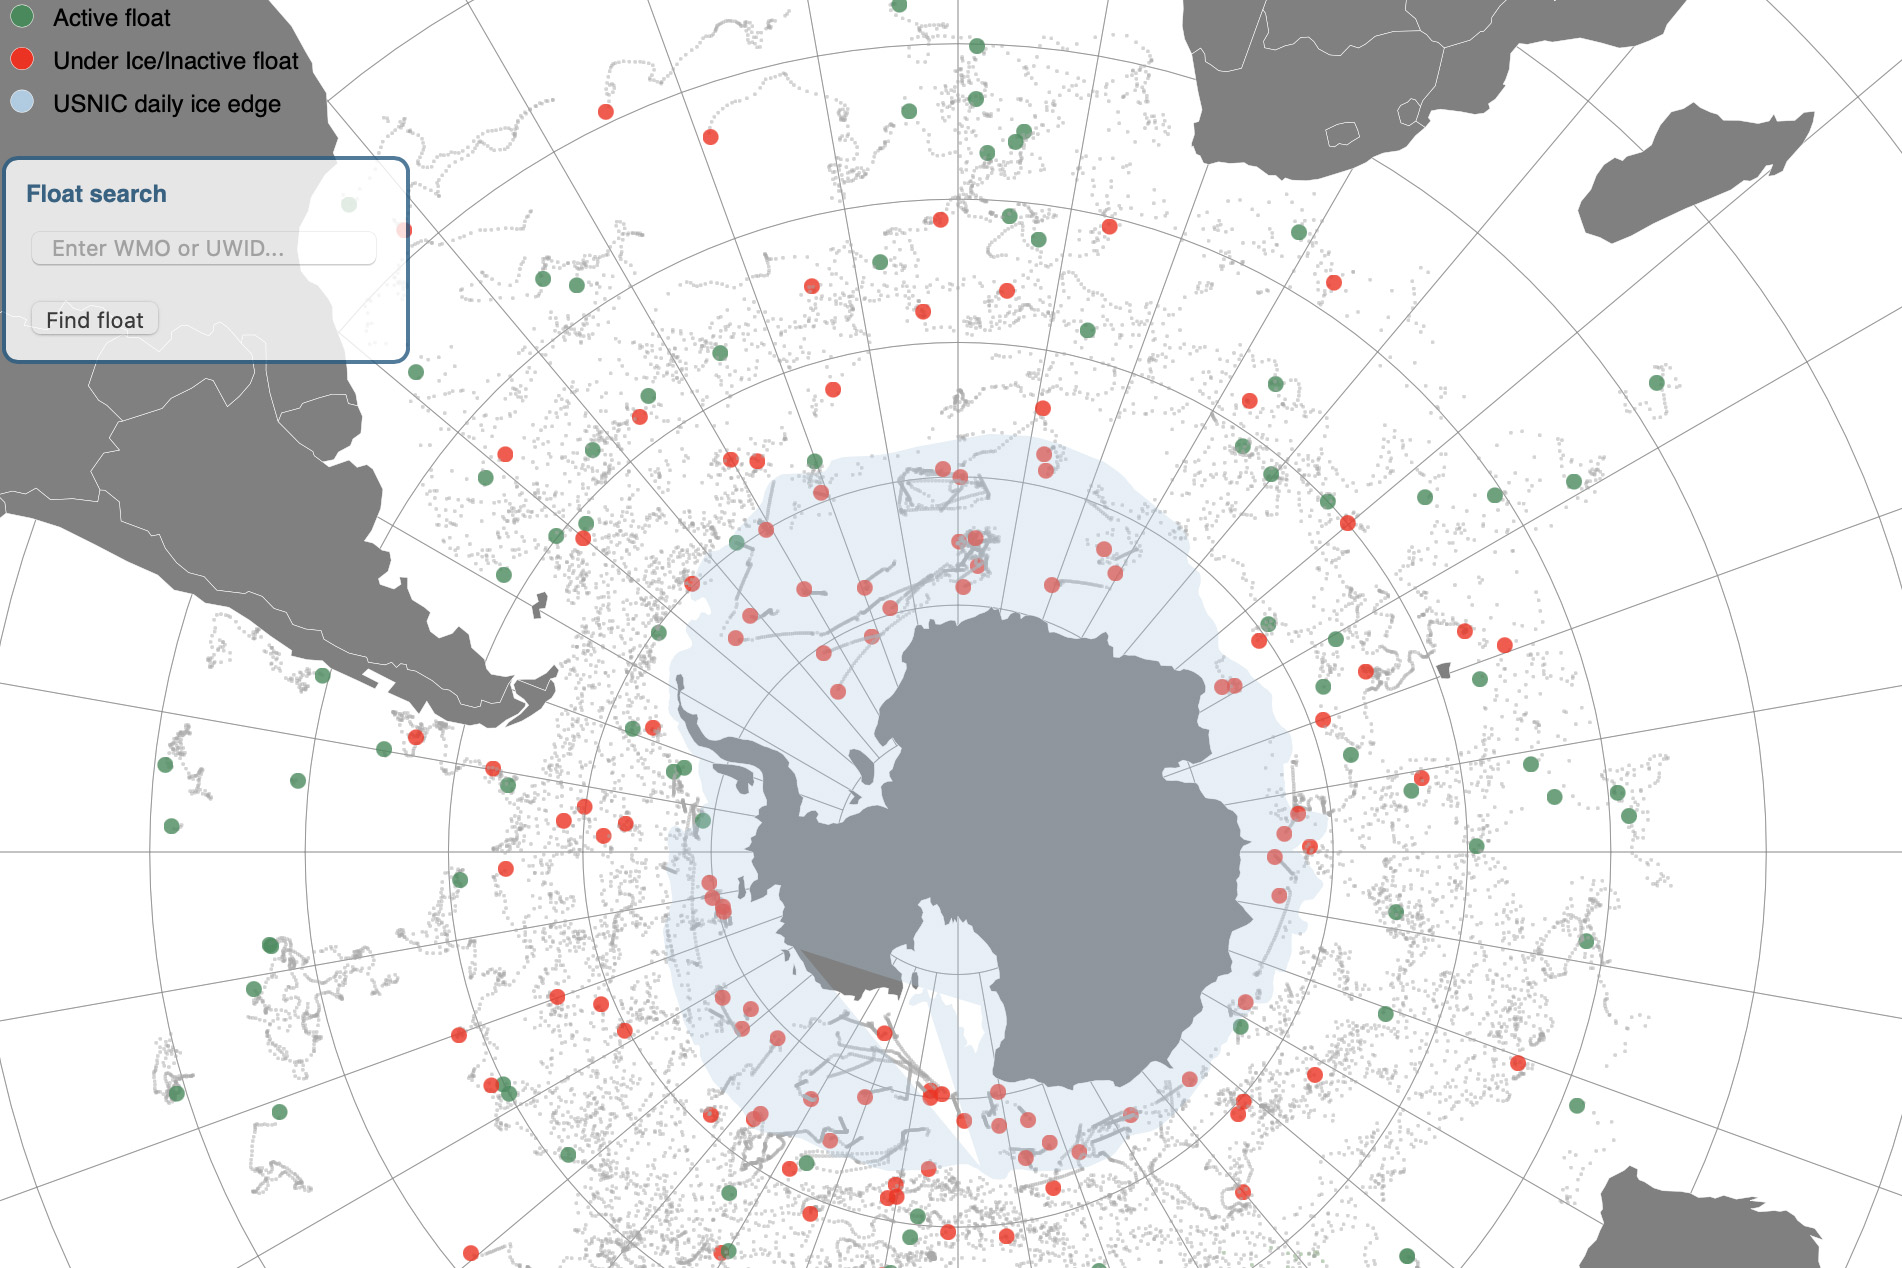
Once you have adopted a float, you can easily access the float data to locate your float, view real-time raw and quality-controlled float data, create graphs, or download digital data. For more information and tutorials, visit our Data Visualization page.
3D Float Visualization
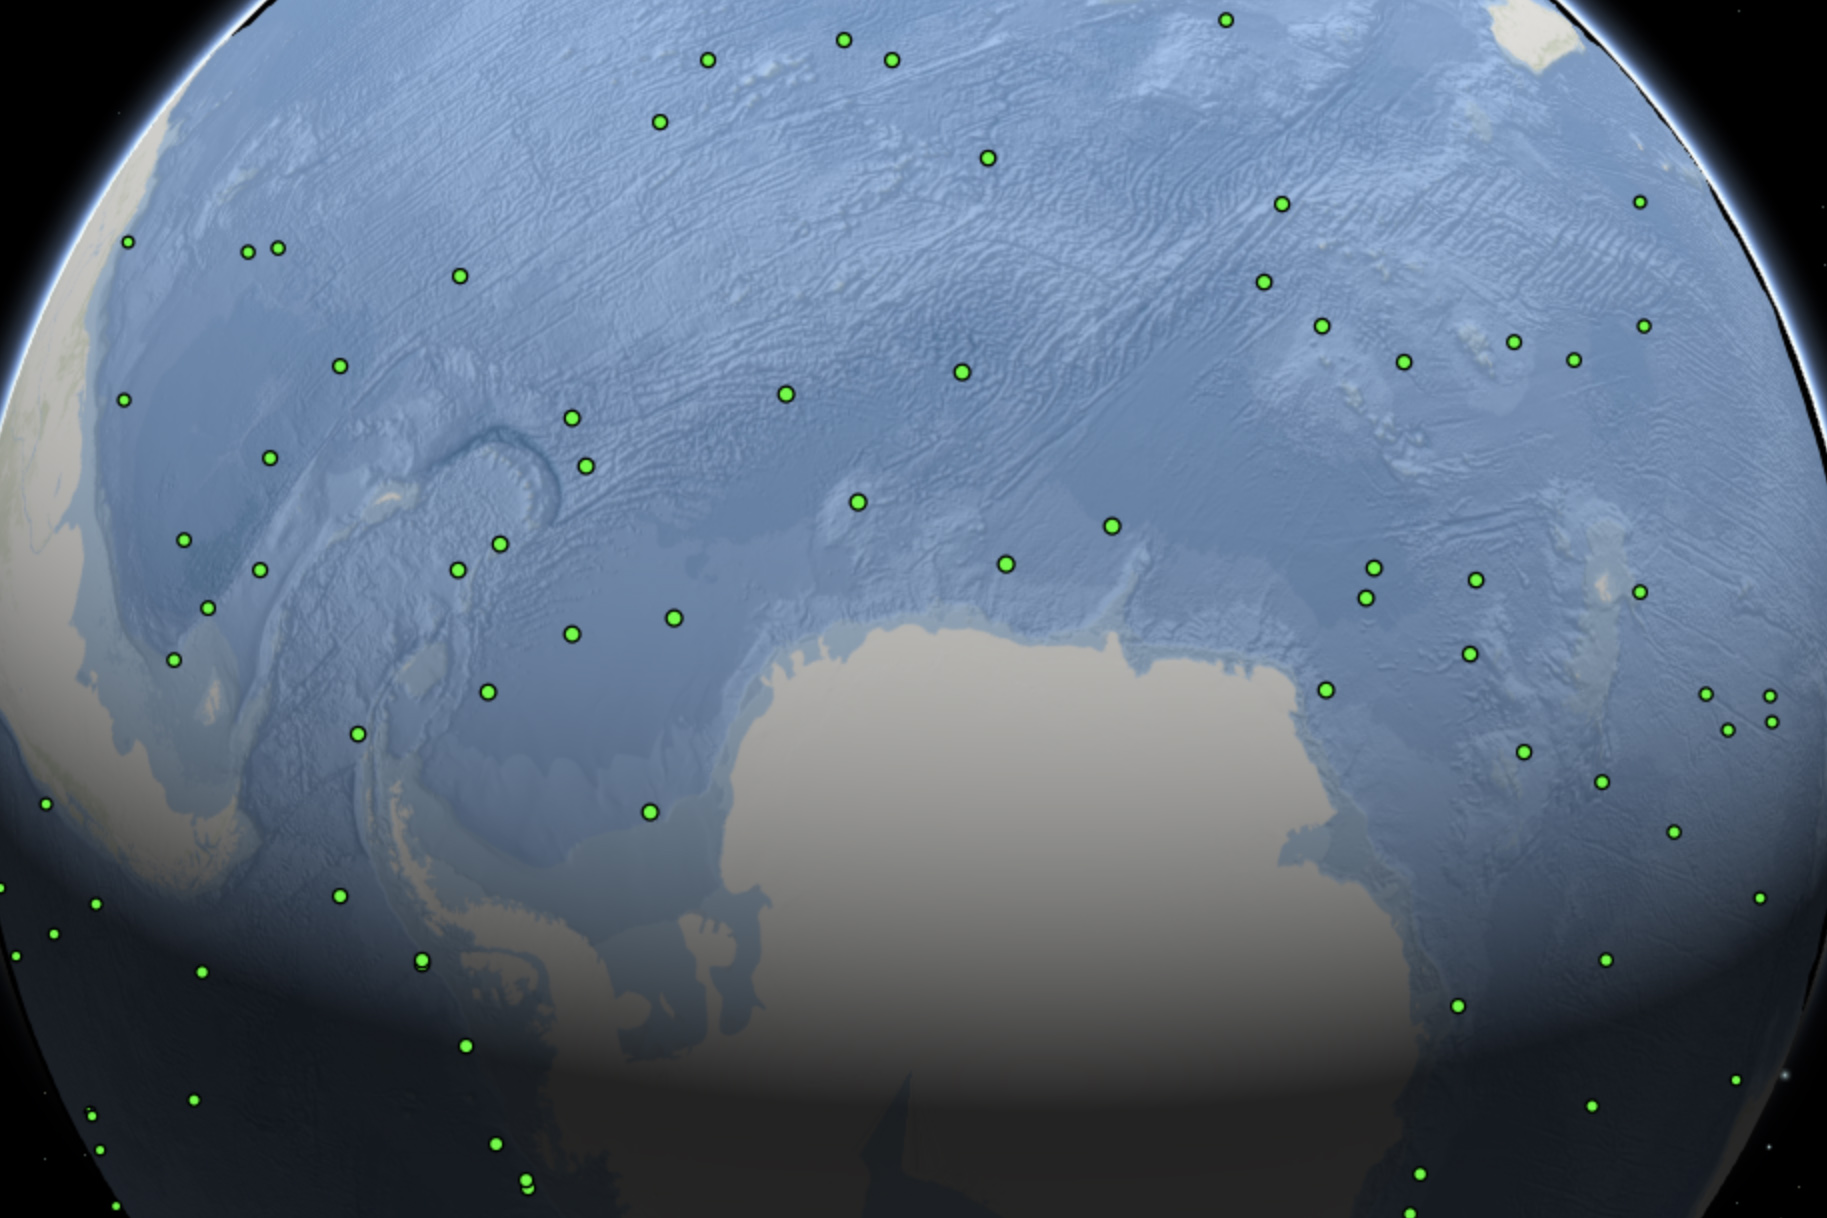
Use your mouse to find your float in this interactive 3D visualization, or use the latitude/longitude of the deployment to help find your location.
Explore Float Data
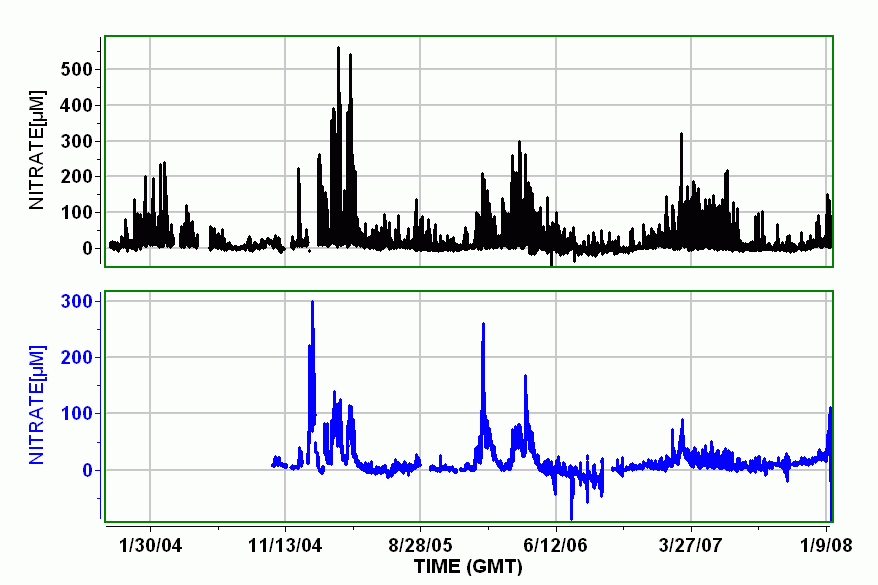
Use AdoptAFloatViz 6.0 to create a graphs or download digital data for adopted floats.
Featured Activities and Lessons
A variety of worksheets and classroom materials have been gathered and/or developed by educators who have adopted floats and used the data in their classrooms. The following activities, lesson plans, and learning modules can help students understand and synthesize different types of float data.
A Deeper Look at Floats
These resources contain more in-depth information about floats and float data.
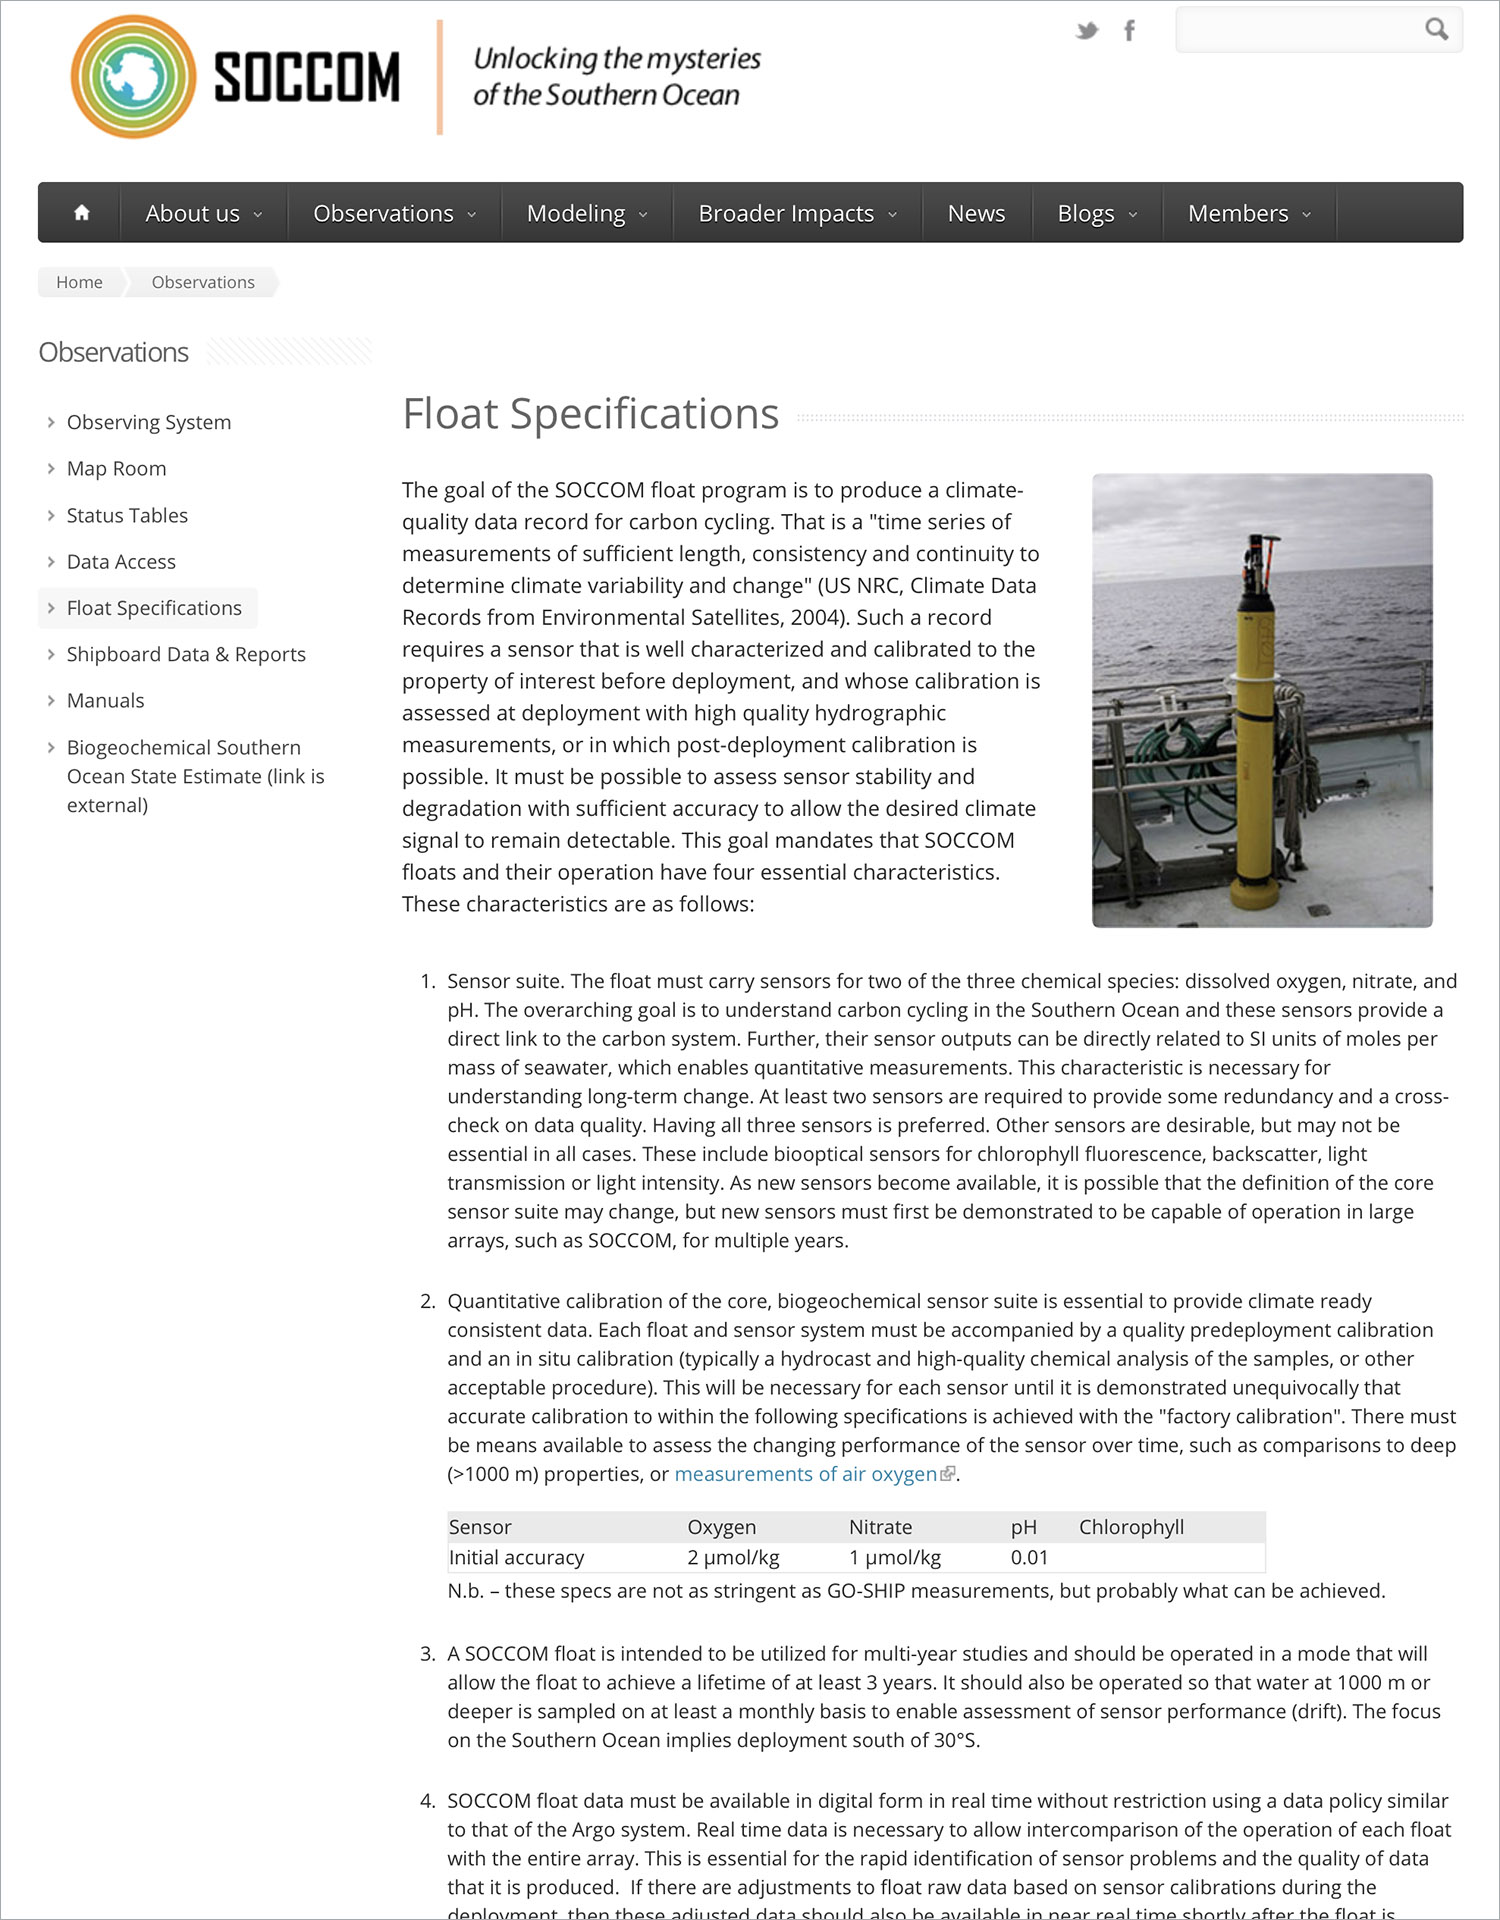
Float Specifications
Information webpage that details the four essential characteristics of floats.
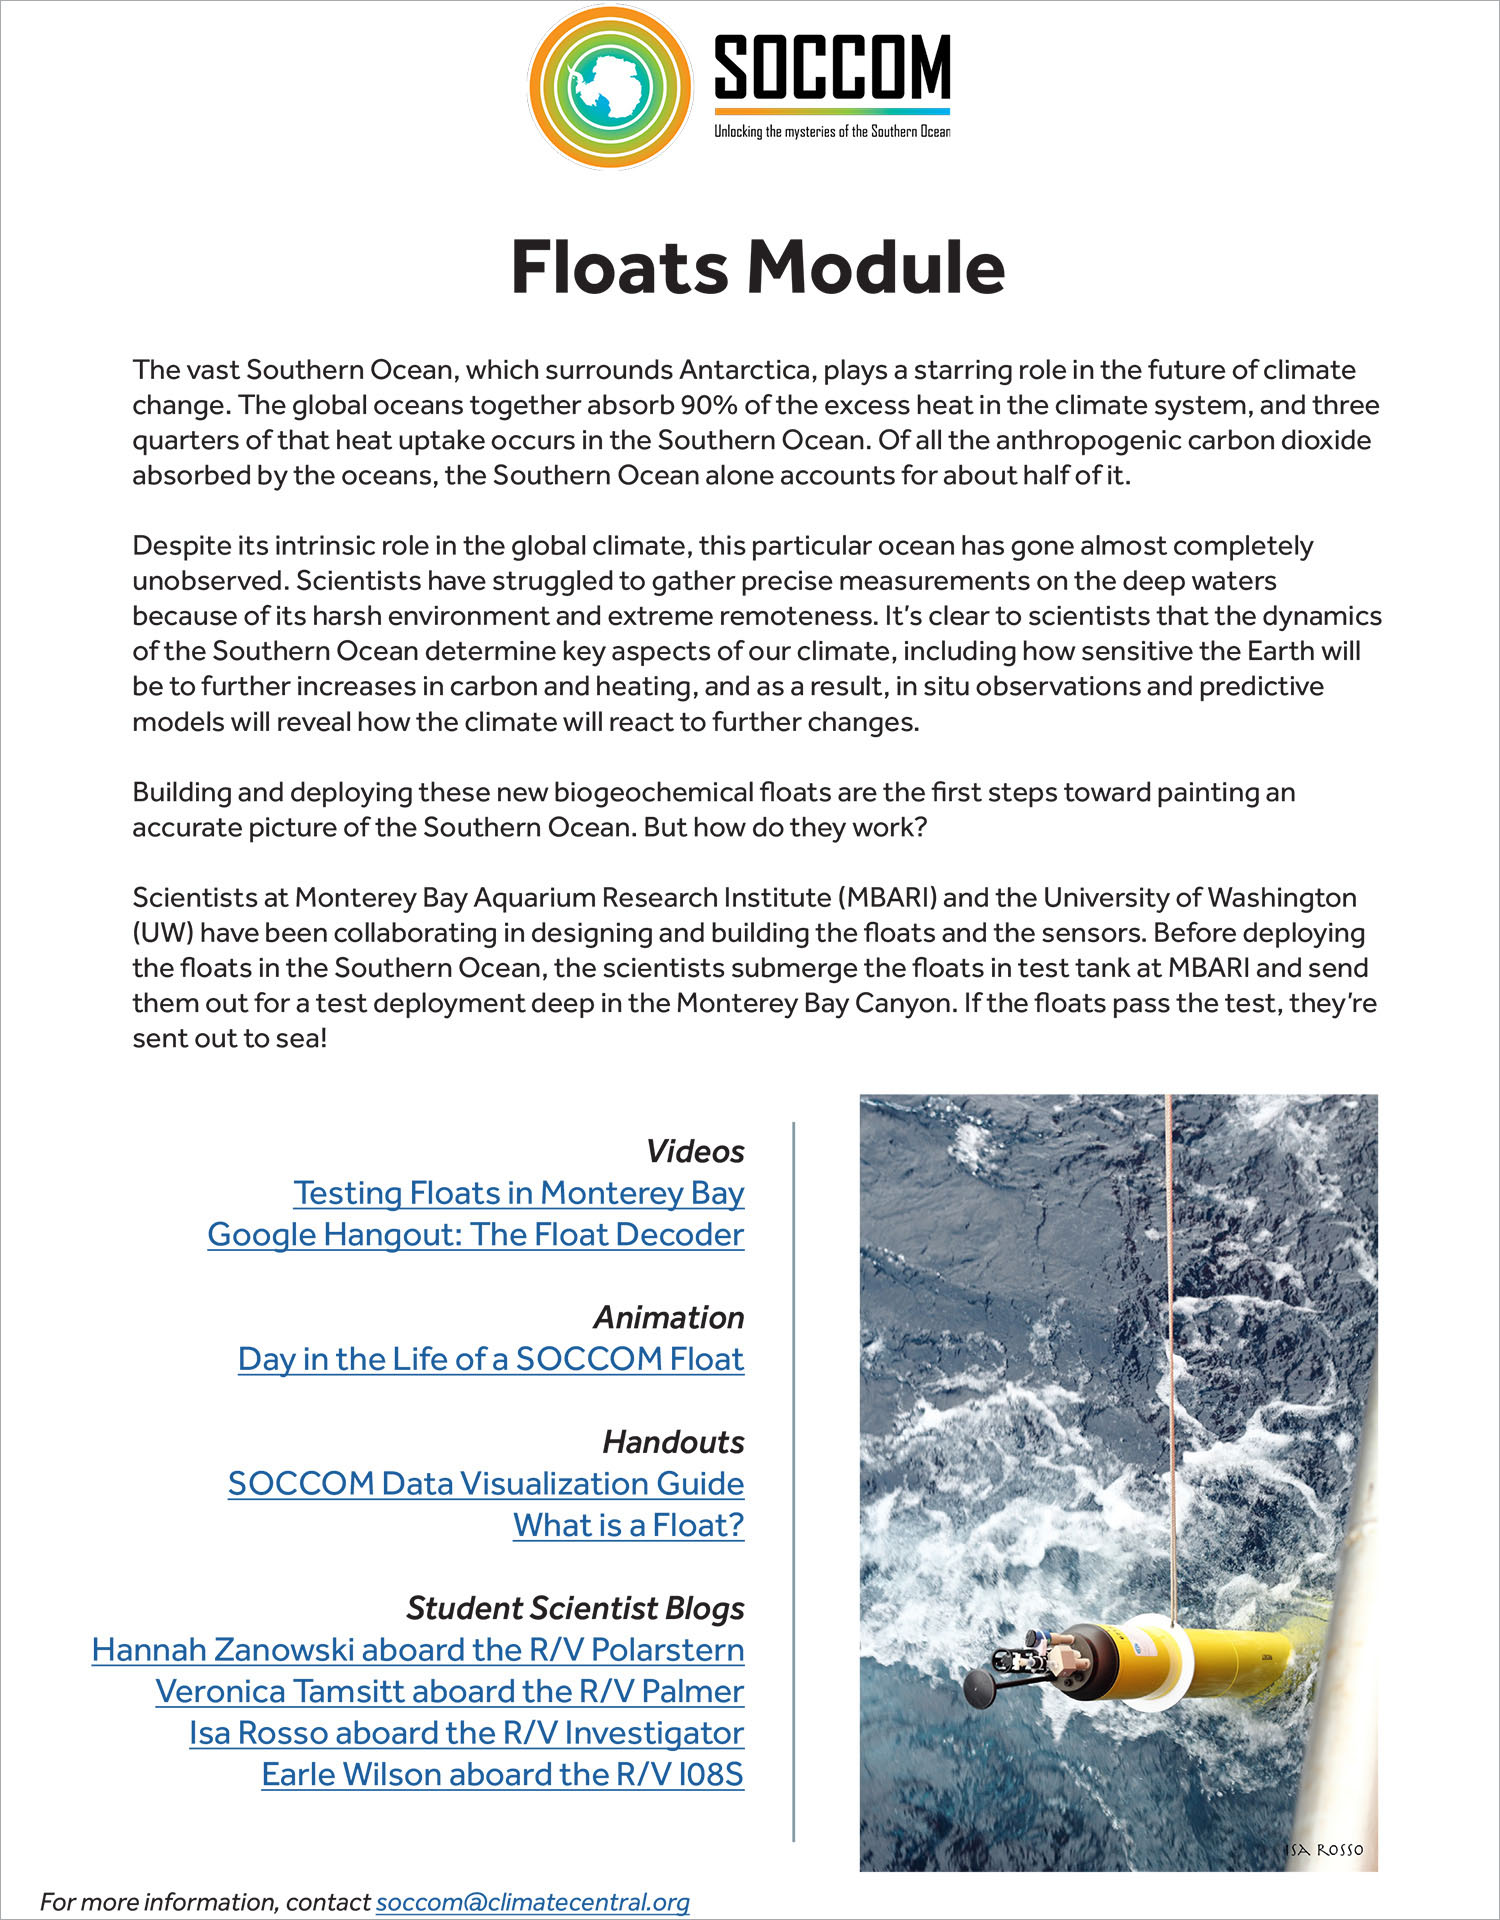
Floats Module
Multimedia module about building and deploying these new biogeochemical floats and how they work.

