Eagles in the Deep—George Eisenhut Elementary in Modesto, CA
Location: 4º31’N, 25º45’
Time: FRI 17 MAR 2023 17:50 UTC
Float Number: 1356 (WMO: 4903486)
Float Type: Navis
Float Program: GO-BGC
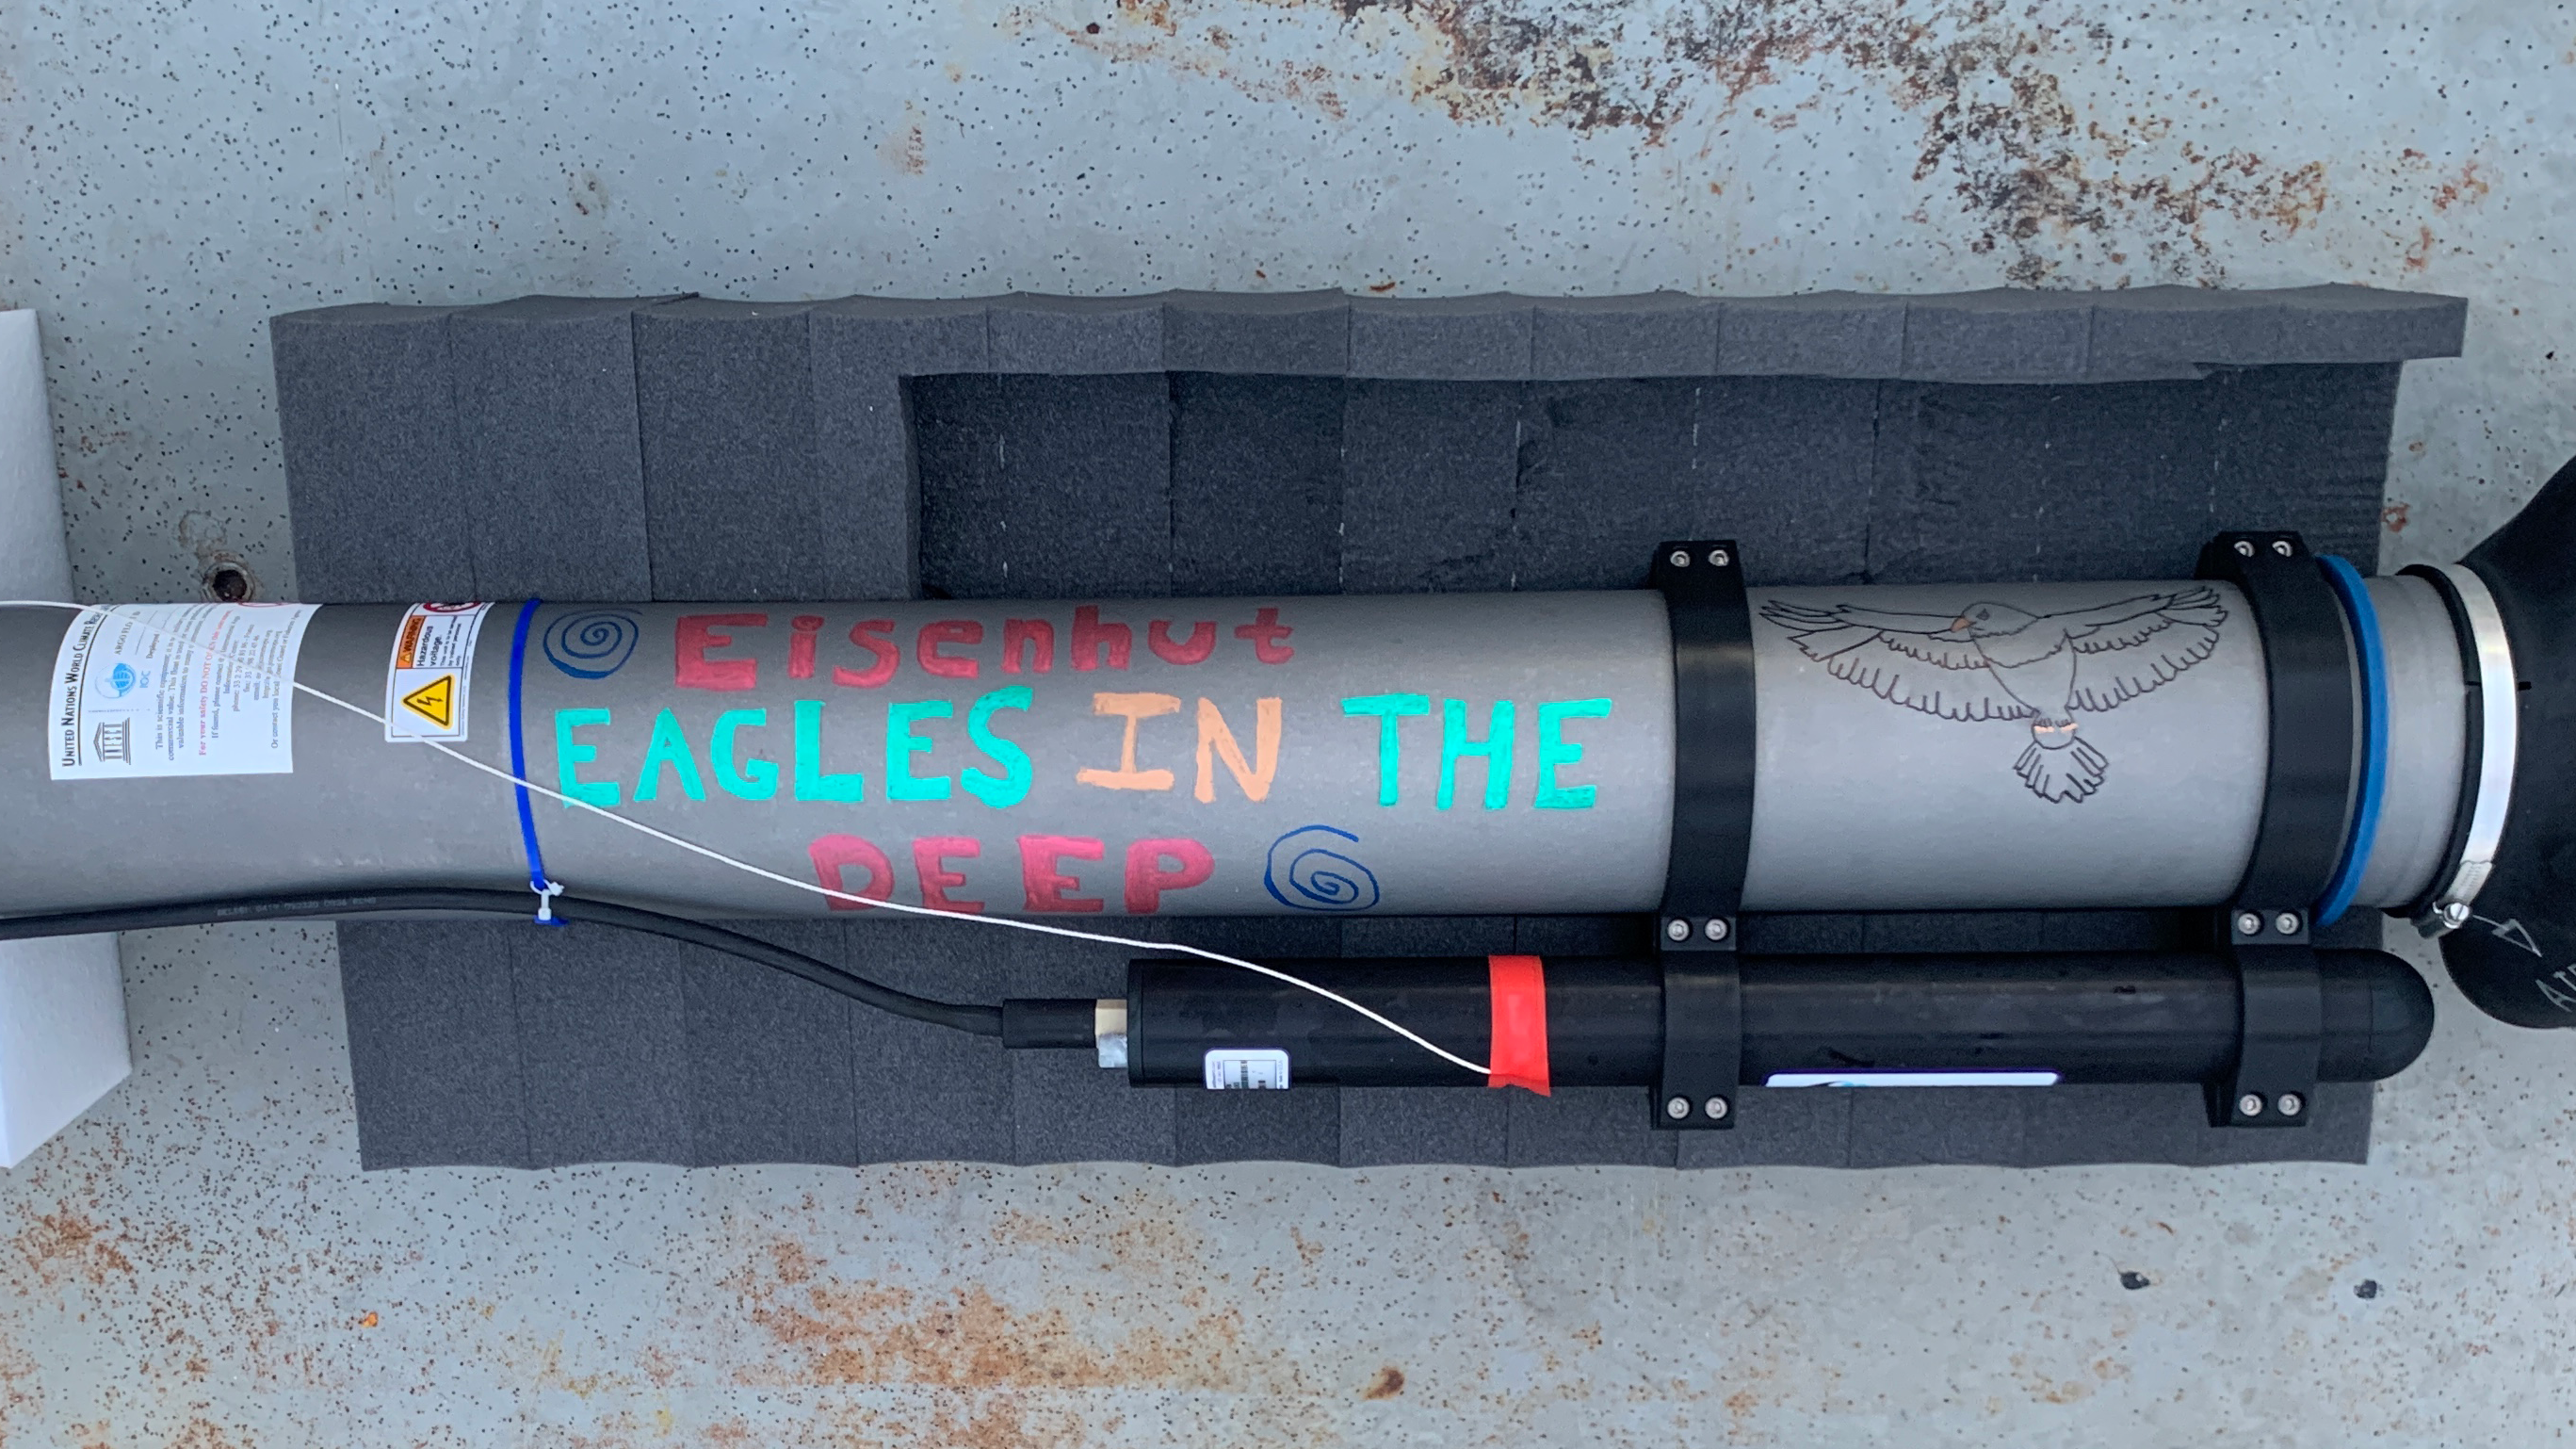
The lucky float deployed on St. Patrick’s Day was adopted by George Eisenhut Elementary in Modesto, CA. The float’s name is based on the school’s mascot which is an eagle.

Eagles in the Deep staged on deck for deployment. Photo by Ellen Park.
Safety first
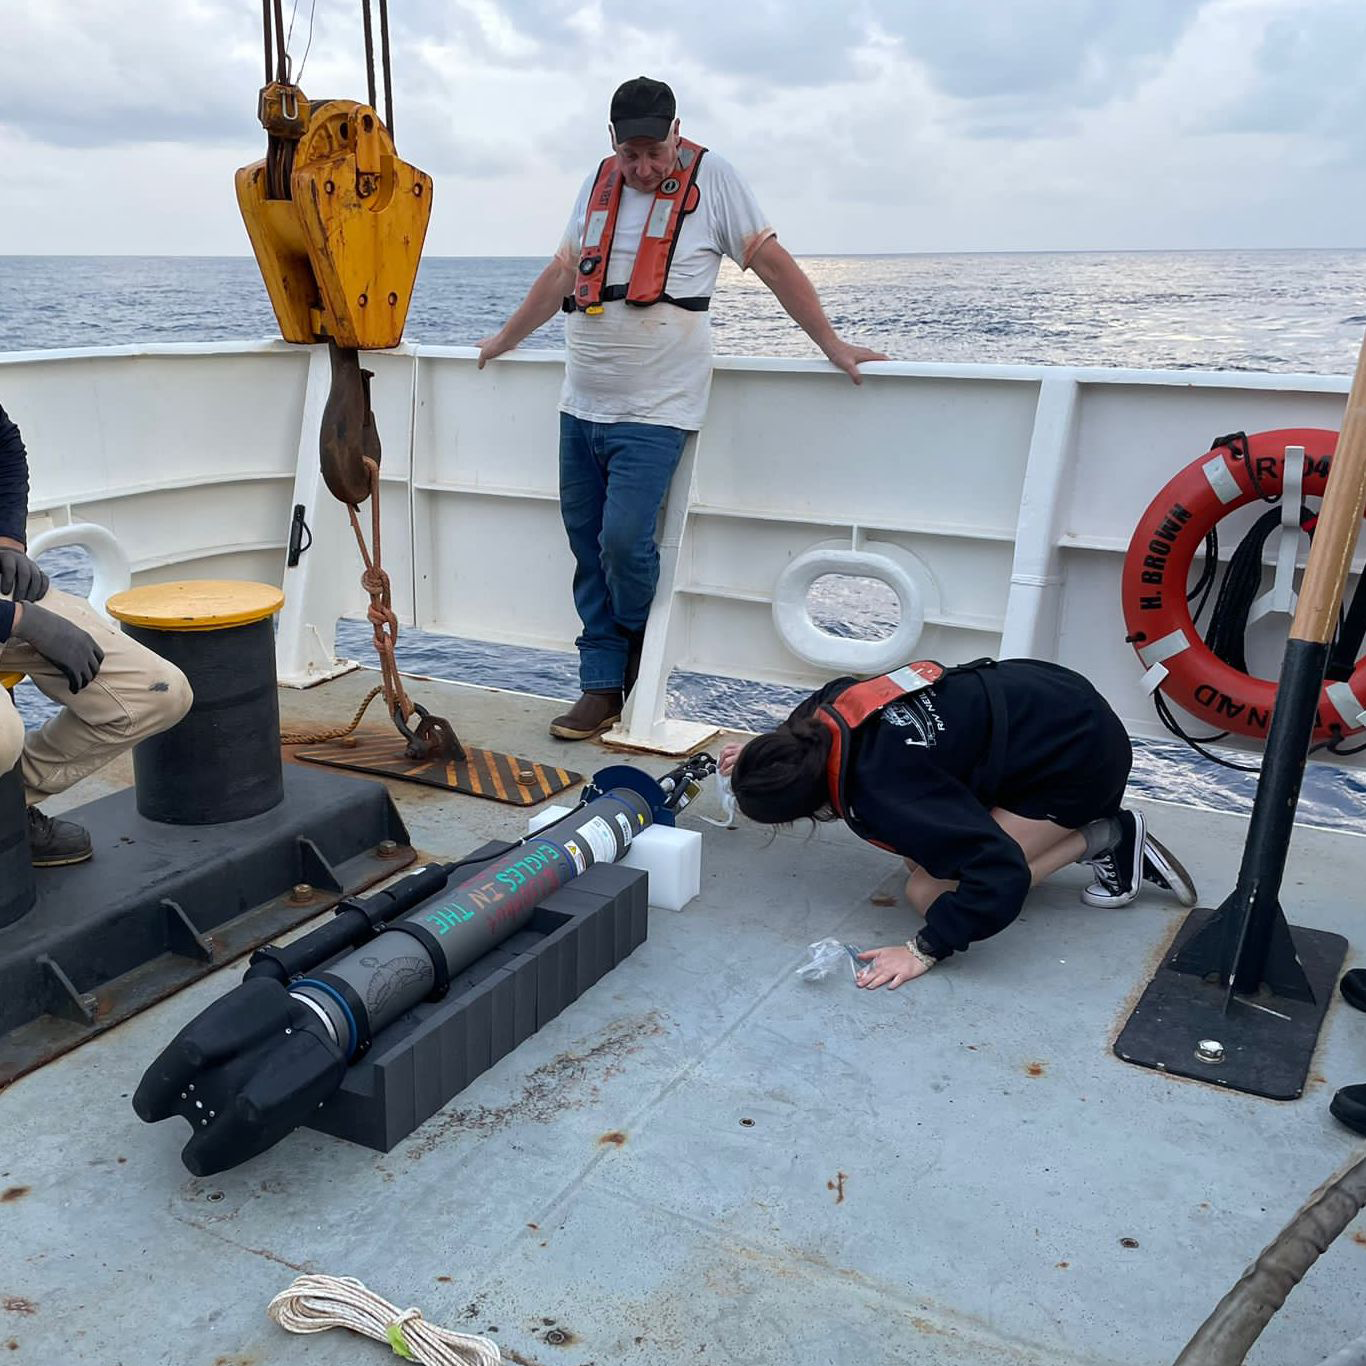
The floats are quite heavy, so it is best to have two people carry the float out for staging. That way everyone can keep one hand for the ship for safety.
Before deploying, we check to make sure that the optical sensors, which are used for measuring backscatter, fluorescence, and nitrate, are clean. If not, we clean them with deionized water and a lens wipe.


Michael Gornto (front) and Frank Forbell (back) carrying Eagles in the Deep from the main lab to the fantail for staging. Photo by Melissa Miller.
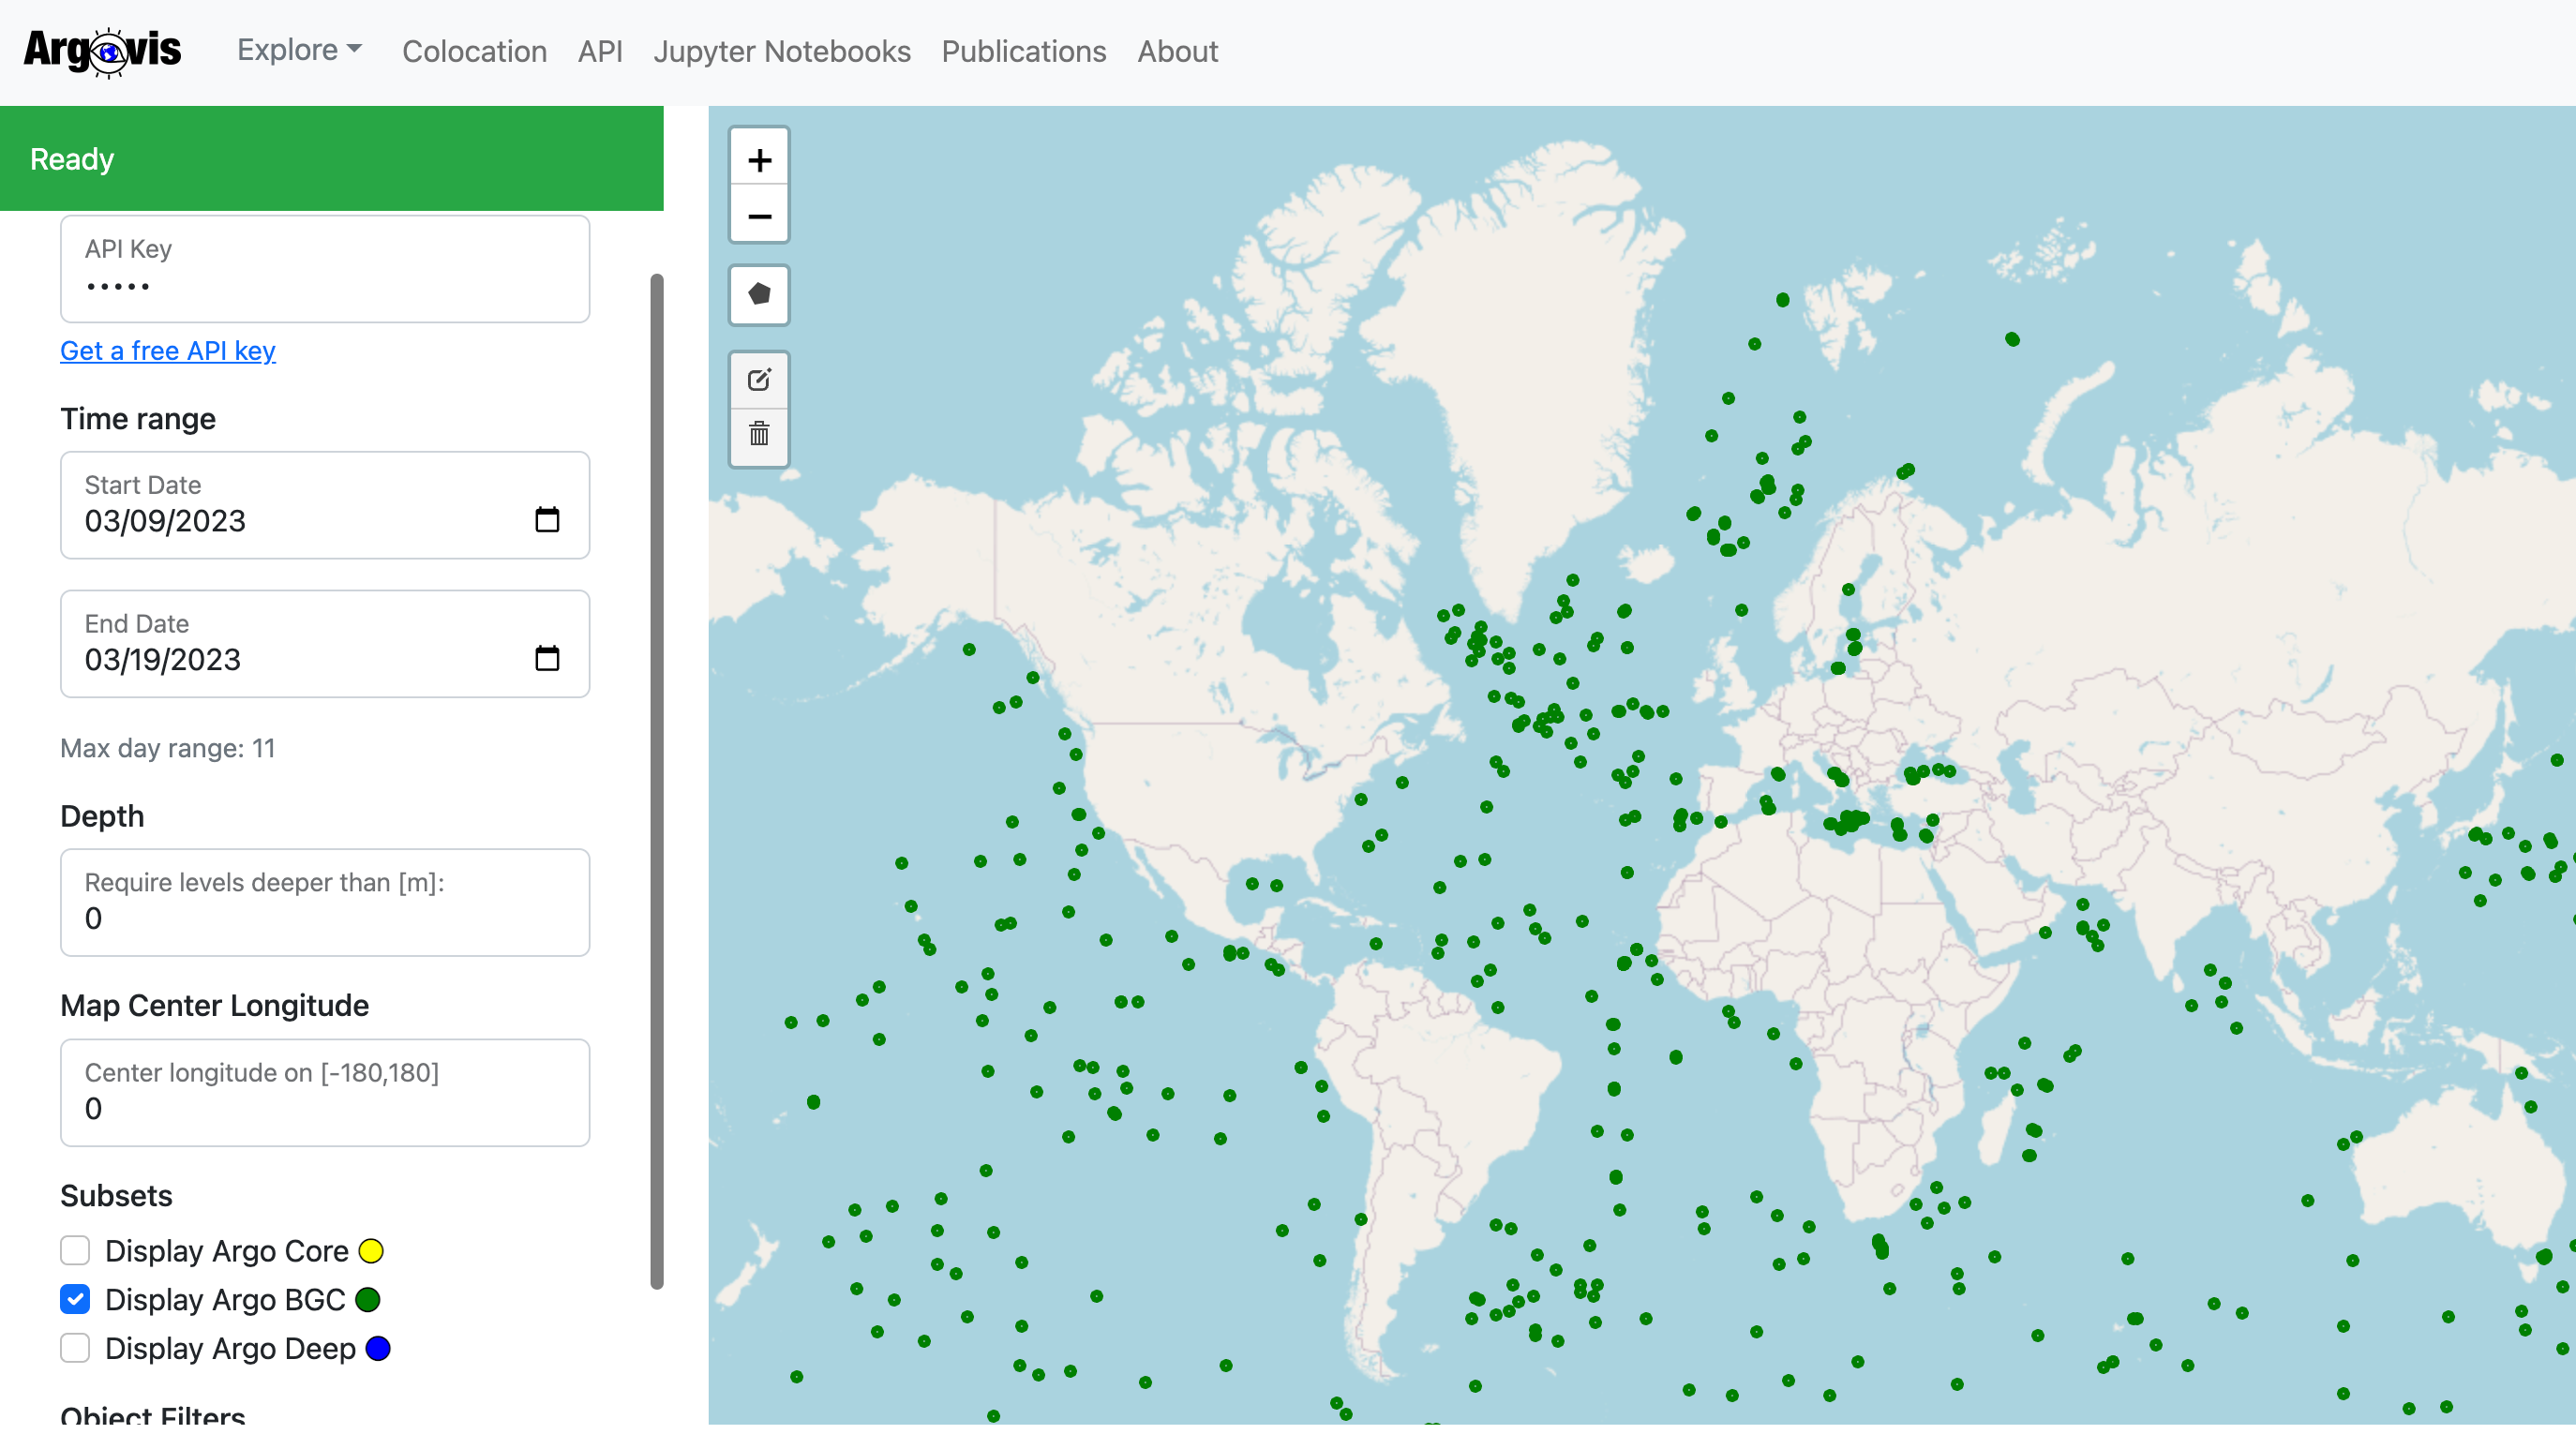
Once the float is deployed and it begins its mission, the data for each float, which is freely available online, can be downloaded. However, if you don’t want to download the data and just want a quick visualization, check out Argovis (https://argovis.colorado.edu/argo)! Using the floats World Meteorological Organization (WMO) number, you can look at all or a selection of the profiles collected.

Accessing the data
To do this, follow these steps:
- Go to the ArgoVis site. Once the data is loaded, scroll down on the panel on the left-hand side until you see Object Filters: Argo platform ID number. Enter the float WMO there.
- Once the data has loaded, you should see a green dot on the map corresponding to that float. Click the green dot and click on the link to the “Platform Page.” This will load all of the profiles collected by this float.
- The default plot shows all of the temperature profiles colored by time. You can change the plotted variable in the “x-axis variable” box in the left-hand panel. Delete the word “temperature,” and a drop down of all the variable options should appear. You can play around with the x-axis, y-axis and color variable to plot different parameters.
- To look at individual profiles, scroll down below the plot, and you should see a “Profiles” sections. This is a list of all of the individual profiles that are plotted. Un-select “Show” and then select as many or as few profiles that you want to plot.
This tool is a great way to visualize data without having to directly handle the data! You can also use the nifty Adopt-A-Float vis page developed for students.
And on the Adopt-A-Float page, you can find both a video and a powerpoint presentation on how to access data.
